Best in Category - Digital Design 2022

Three Corners of the City

James Berrett / Sonja Pedell / Simone Taffe / Swinburne University of Technology

Three Corners of the City is a real-time data visualisation that connects three communities across place and across time.

Three Corners of the City is a real-time interactive data visualisation that connects three local communities in Melbourne across place and across time. Live data touchpoints record people walking 24 hours a day, 7 days a week, in three communities in an interconnecting flow of everyday life, breathing life and form into dynamically evolving motion graphics. The project engages citizens with smart city data visualised in aesthetically pleasing and tangible ways. The visualisation is publicly exhibited on a large-scale interactive media wall in the foyer of the award-winning Bunjil Place community hub.

Design Brief:

The project aim was to engage local communities with live smart city data collected and stored on the City of Casey Open Data Platform in aesthetically pleasing and tangible ways. Using three real-time data sets from Narre Warren, Berwick and Cranbourne, captured with IoT (Internet of Things) sensors, the data needed to be visualised in real-time and displayed on a large-scale, publicly accessible, interactive media wall (across 8 screen panels, 3m wide x 1.5m high with a combined pixel resolution of 7680px by 2160px) in the entrance of the award-winning Bunjil Place in Narre Warren, Melbourne.

In addition to the digital data visualisation, postcards were designed for community members to engage further with the work in the form of citizen activations. It was important to not only have a digital component but to form a digital identity through connecting the self-generated data and the digital artwork.


This project was developed by:

Design Process

The design process for Three Corners of the City involved three key stages: 1) discovery; 2) conceptualisation; 3) execution.

In stage one we met with the client to understand their needs and goals, which centred around building awareness of the City of Casey Open Data platform and to encourage members of the community to engage with smart city data. It was important to increase the transparency of the data being collected and to demonstrate how it could be used in interesting and novel ways. We defined an overarching theme that was relevant to the Council’s urban development vision and hence decided on pedestrian movement in communities.

In the second stage we needed to understand what kind of data was available and how the data could be accessed from the Open Data platform. At the beginning of the project the platform was not launched to the public and did not have fully accessible data sets. This meant that we needed to generate build our prototypes from our own data for testing.

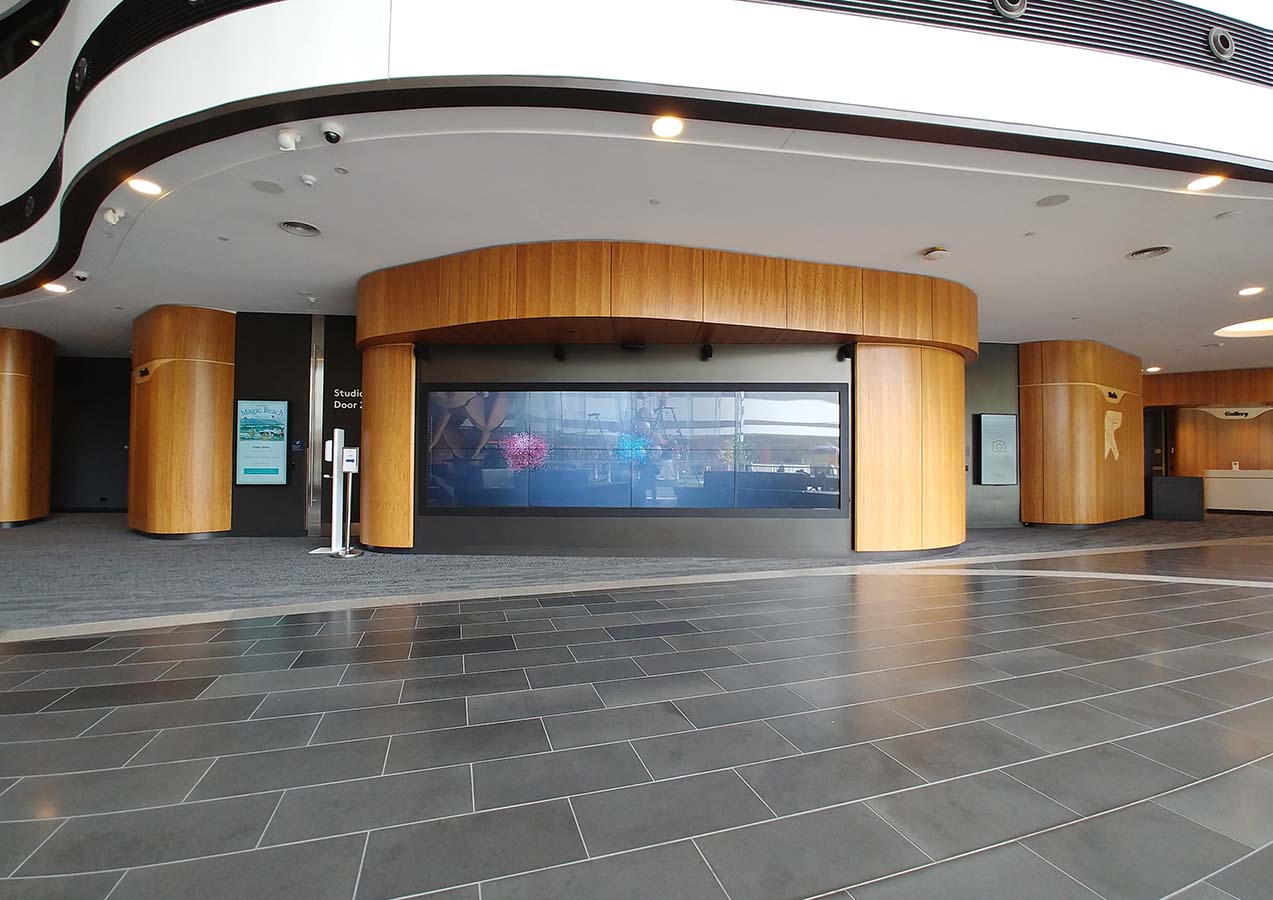
As the project developed we were able to begin using the live data that was being captured in each of the three locations. As Three Corners of the City was created during one of Melbourne’s extended lockdown’s (September-October 2021) it was impossible to test on site. We came up with a solution where several computer monitors were connected together from home to mimic the large-scale screen at Bunjil Place. An iterative approach was crucial, and the visual design of the work was tested and reviewed to ensure the communicative aspects were clear and understandable. As the final design was nearing completion we were able to work with City of Casey remotely to test, tweak and implement the work on site.

Design Excellence

The project is designed to showcase and compare pedestrian movement across three communities in the City of Casey, each contained to their own ebb and flow of daily routines. The project presents large data sets about the movement of the community through dynamic visual communication. Swells of movement in each location can be seen simultaneously allowing the audience to notice patterns and draw comparisons between the data sets.

The use of motion presents the data dynamically and encourages deeper engagement from its audience. The density, colour and motion of particles communicate the amount of movement in each location clearly and effectively. The visual design and motion of the abstract forms are inspired by the theme of the project being community movement. The graphic style invites viewers to immerse themselves in the work and prompts them to see the data in a new way – in their own way. An information overlay indicates the day of the month (left side) and time of day (right side) as the visualisation cycles through each hour.

Visualising data through dynamic design like motion graphics makes it more approachable, memorable and engaging – viewers don’t have to make sense of endless rows and columns of data in a spreadsheet. In this way it provides viewers with a snapshot of what is happening in the community and it is less likely to have language barriers which was a key requirement for these multicultural communities. The project is designed to use live data sets and visualise the data in real-time through motion graphics which can only be achieved via the creation of a standalone application which we have designed from scratch.

Design Innovation

Visualising real-time community data with motion graphics is novel. There is rich potential for smart city data to engage a wide audience, however currently this data is mostly used for statistical purposes and is often difficult to comprehend or “boring’ for community members - in particular younger audiences.

Three Corners of the City aims to inform and address these challenges in a unique way using motion graphics. Motion graphics have the ability to communicate complex information visually to a wide range of audiences in an engaging and easy to understand manner.

Three Corners of the City highlights the enormous potential for the visualisation of community data in real-time to inform city planning. In this case it is especially useful for visualising traffic flows and to support pedestrian safety in high-traffic areas of each of the three communities. Through the formation of three community clusters, each data set controls the density, colour intensity, speed and direction of graphic shapes. Through dynamic visual design, the data highlighted how closely people in each location were following the COVID curfews that were in place in Melbourne at the time. Using real-time data to drive real-time motion graphics is unique for the field.

Traditional creative approaches for motion graphics do not apply to real-time environments – new workflows must be developed. Motion graphics are commonly created in timeline-based applications, however in the case of Three Corners of the City, a game engine has been used to produce the work.

Design Impact

Within the trend of City Councils in Australia to involve communities into their planning, appealing and comprehensible data visualisations are needed to engage people in discussions. Local Governments aim for creating Smart communities as part of their Smart City agendas creating meaning and inclusion around data collected. By focusing energy on creating accessible data visualisations City Councils have the opportunity to create a modern positive brand, rather than being perceived as conservative or “boring” and associated with complaints, parking fines and rubbish collection.

Digital data visualisations can be used to share important and insightful information to community members when presented in aesthetically pleasing and engaging ways using motion graphics. In addition, offering printed postcards as part of Three Corners of the City project makes the data from each community more tangible, promoting communal awareness and collective engagement. Three Corners of the City provides the City of Casey with new ways to engage with their community members around smart city data and helps to inform conversations about society, economy and the environment with stakeholders.

The project demonstrates how real-time captured data can be used in innovative ways, specifically, Three Corners of the City visualises when members of each community are on the move. Three Corners of the City is also featured on the City of Casey Open Data platform as a ‘Community Open Data Innovation’ to inspire people in the community to use the platform and to think about how they might be able to use the data in their own way.

Digital Design 2022 Finalists

Scouts I Terrain

Scouts Australia / Two Bulls/DEPT®️

Iron App

Maria Tongson / Dr Scott Mitchell (Research Supervisor) / RMIT University

SmileyscopeMRI

Smileyscope Pty Ltd

Craft Victoria

Liquorice / Craft Victoria / Studio Round

Strong Care

StrongRoom AI / Isabella Jorgensen

The Future of Personal Data Ownership

Mo Works / PwC Middle East

Triceratops: Fate of the Dinosaurs (Act 3)

Sandpit / Klang / Chris Edser

Map Your Future

Today / Youth Disability Advocacy Service

Trash

Bin Chicken Studios

Medicines Development for Global Health Website

Ethical Design Co. / Locase / Meyer Literary / Medicines Development for Global Health